

Rik uses more than twice as much electricity as an average household. His annual bill: €585.
Whoever uses a lot of electricity should normally also have the highest bill. That is how it works, right? Meet Rik from Nieuwkerken-Waas. His household uses almost 10,000 kilowatt hours a year, more than twice as much as an average Flemish household, with a peak consumption of 1,370 kilowatt hours in January. Not a frugal terraced house, then. And yet: we put all his bills from October 2025 up to and including September 2026 side by side. The total: probably the lowest energy bill on the street, even though he has the highest consumption.
Twelve bills, one amount
€585. For a whole year. For 9,861 kilowatt hours. And that literally includes everything: the energy, the grid costs and the capacity tariff. A household without solar panels and without a battery pays well over €3,600 for that same consumption, six times as much. Of those 9,861 kilowatt hours, 4,817 came from the grid. The rest came from his own roof and his battery, at the moment that suited him best.
Seven months in a row of money back
From March up to and including September, Rik got money back from his energy supplier every month instead of the other way round. €417 repaid in total, in months in which the household simply carried on living: 4,872 kilowatt hours used, washing machine, cooking, hot water, everything.
View the figures per month
| Month | Consumption kWh | From the grid kWh | Bill | Market (VNR) |
|---|---|---|---|---|
| Oct 25 | 706 | 395 | €84.04 | ± €254 |
| Nov 25 | 886 | 706 | €174.14 | ± €327 |
| Dec 25 | 1,120 | 1,080 | €250.67 | ± €411 |
| Jan 26 | 1,370 | 1,380 | €356.49 | ± €516 |
| Feb 26 | 906 | 701 | €136.29 | ± €330 |
| Mar 26 | 688 | 102 | -€3.12 | ± €250 |
| Apr 26 | 603 | 92 | -€43.68 | ± €217 |
| May 26 | 685 | 31 | -€69.51 | ± €249 |
| Jun 26 | 690 | 30 | -€116.01 | ± €260 |
| Jul 26 | 850 | 59 | -€70.84 | ± €319 |
| Aug 26 | 795 | 107 | -€68.77 | ± €307 |
| Sep 26 | 560 | 134 | -€44.59 | ± €213 |
Average Flemish household: 3,500 kWh per year (VNR reference profile). Market price: weighted average actual price per kWh incl. VAT for that profile, VNR dashboard consumption prices (September 2026 estimated). Bill amounts incl. VAT from the settlements of Elindus (Oct 2025 to Feb 2026) and Dots energy (Mar to Sep 2026). Consumption and offtake from the Smart-E-Grid dashboard.
Rik and his household took thirty kilowatt hours from the grid over an entire month. That is less than a fridge uses in that period. The rest of the consumption was covered by solar energy and its storage in the battery. What the panels produced in excess went into the battery first and only onto the grid when the price was high. In June Rik received 10.5 cents per kilowatt hour fed in. On the market that was 3 cents.
Yes, but what about winter?
We can hear you thinking. In December and January the panels hardly produce anything and the household uses the most. True. In January Rik took 1,380 kilowatt hours from the grid, almost everything the house needed. His bill: €356. Not nothing. But without solar panels, battery and smart control it would have been €516, and that for a month in which the sun barely showed up. The battery does different work in winter than in summer: it does not store sun, but buys cheaply at night and covers the house in the expensive hours. That way Rik can be sure his energy bill is optimised.
October up to and including February. The panels deliver little, the house demands a lot. The battery buys cheaply at night and covers the house in the expensive hours.
March up to and including September. The sun fills the house and the battery, the surplus goes onto the grid when the price is high.
How does Rik do it?
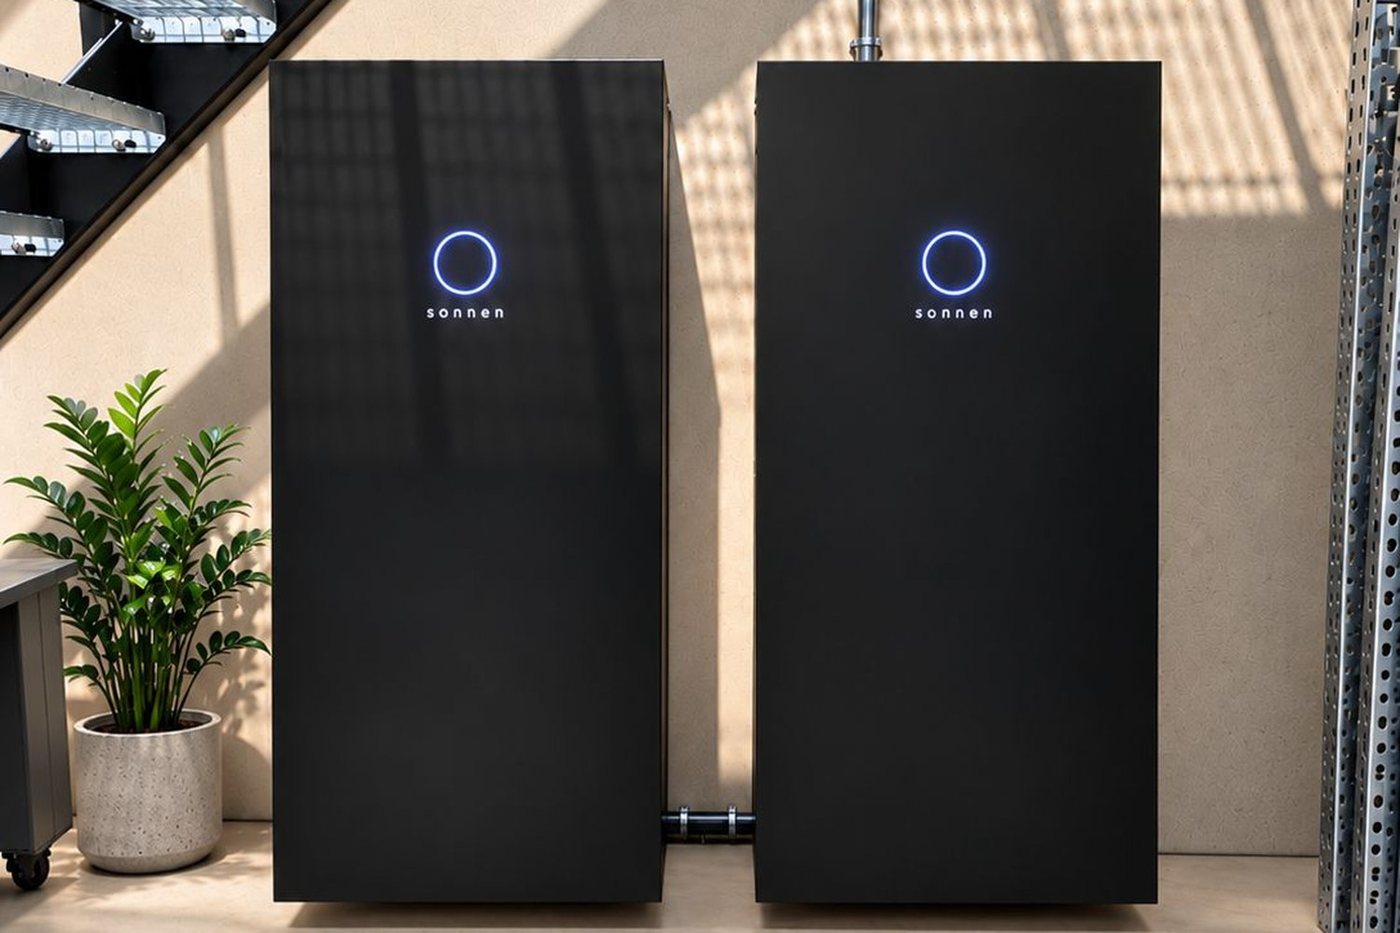
Not by being frugal. But with an installation that fits and is sized for the consumption of the household itself (and not that of the neighbours):
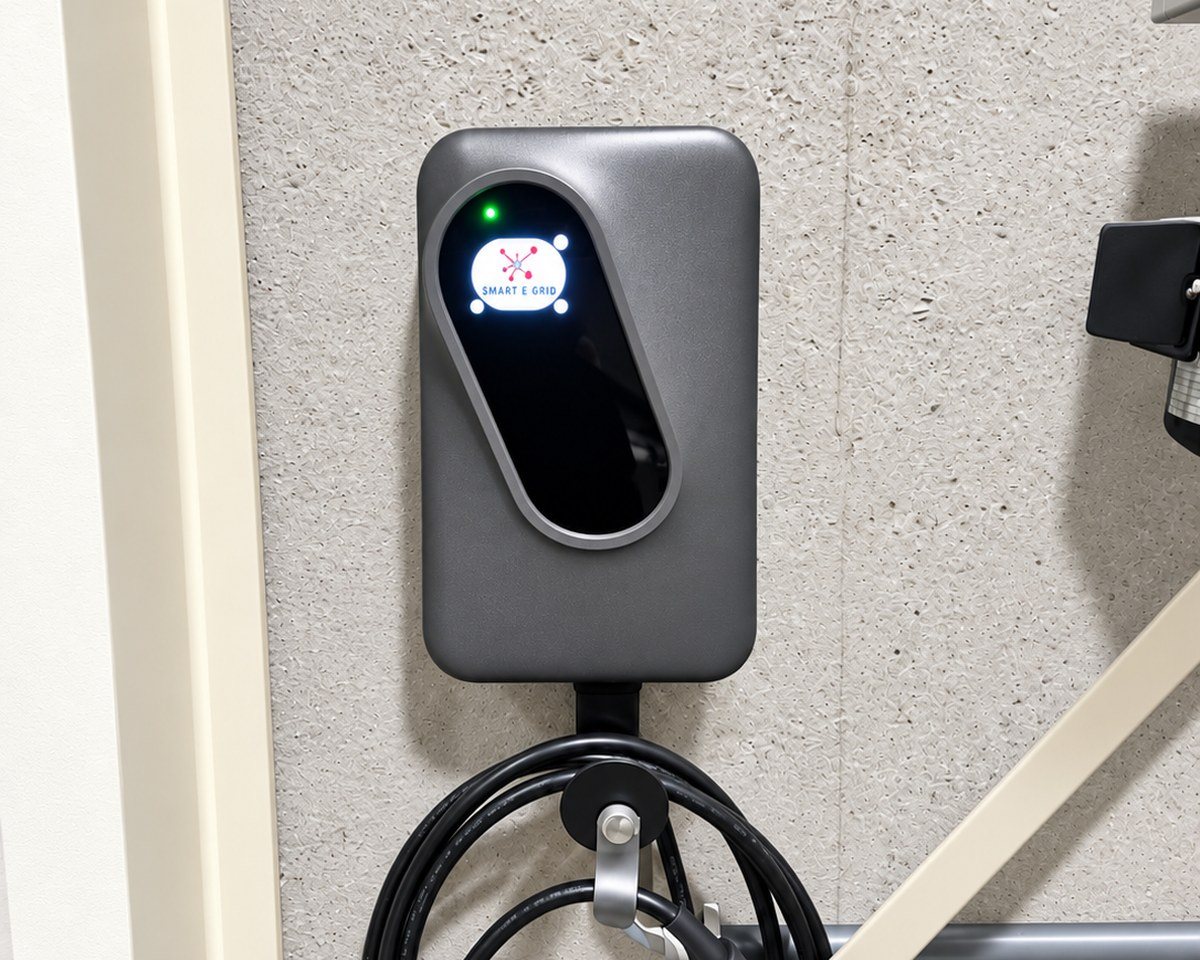
The control system looks at the sun, the market prices and what the household needs, and decides at every moment where the electricity goes or what consumption/feed-in is needed: the house, the battery or the grid. It does that not only on the day-ahead market, but also on the imbalance market, which most dynamic contracts do not reach. And Rik's battery does more than store sun: Smart-E-Grid deploys it on the different energy markets for an optimal return. It buys when electricity is cheap, sells when electricity is expensive and steps in when the grid threatens to go out of balance. That helps keep the grid stable, and Rik receives a payment for that every month, settled directly on his bill.
How to read these figures
This is the result of one household over twelve months, with an installation sized to their consumption. The lesson is not that everyone ends up at €585. The lesson is that high consumption is not a disadvantage: the more you use, the more every kilowatt hour that you generate, store or shift yourself earns you. Your figure depends on your solar production, your battery, your consumption and the moment at which you consume. Past results offer no guarantee of future performance.
One more nuance. The electricity price also moves with fossil fuels, because gas plants often set the price on the wholesale market. The difference lies in what you can do about it yourself: generate, store and shift to the cheapest moment.
Do you also use more than your neighbours?
Then this story was written for you. No solar panels or battery yet? Calculate what you can save, tailored to your consumption.
Already have an installation? Ask your adviser to check whether your inverter is controllable, whether your battery is sized correctly and whether your consumption is smartly controlled. Have your installation checked.
Related articles

Jim and Martine drove 7,610 kilometres in August and September for €94. At the pump it would have been €1,269.
Two electric cars, two months, 7,610 kilometres. We put the energy bills of a Smart-E-Grid customer next to today's pump prices. This is what smart home charging really delivers.

Two solar installations in Leuven make public infrastructure ready for the future
For a university in Leuven, Opteco built two solar installations (on the central warehouse and across the administrative complex) with a combined capacity of more than 574 kWp. A concrete example of how public infrastructure is evolving step by step towards an energy-neutral future.

Where history and solar energy meet: working on the Felix Pakhuis
On the roof of the Felix Pakhuis in the heart of Antwerp we installed solar panels on a heritage building, with extra equipment and a crane to get all the panels up to the roof. The result: a historic building that is fully part of the energy transition.